 and
and  sec.
sec.  , resulting in parameters
  and
and  sec.
sec. , resulting in parameters
  and
and  sec.
sec. Controller verification simulation examples.
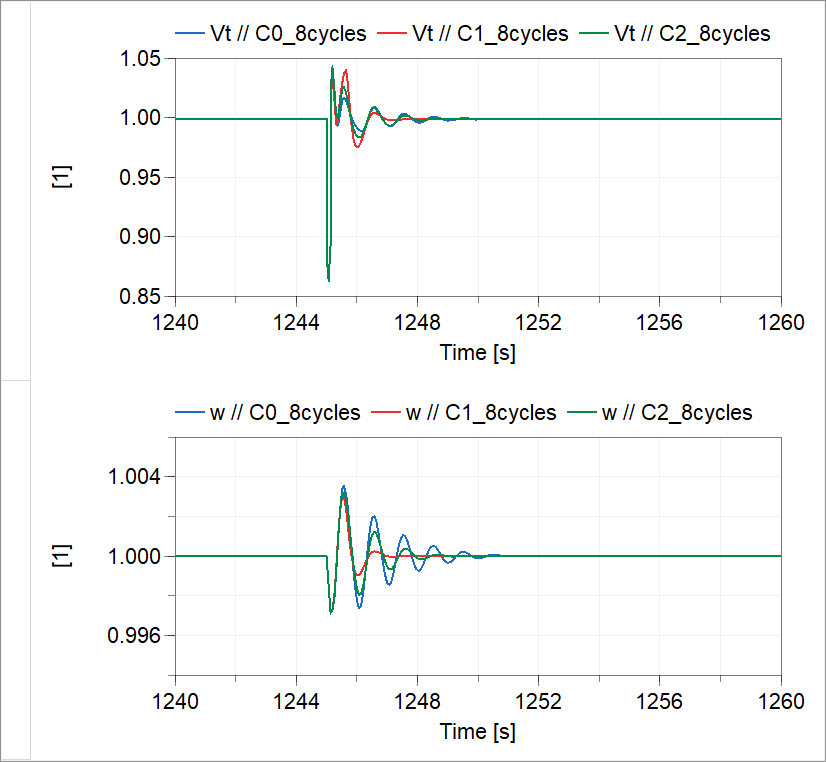
This package is configured to simulate the response to an 8-cycle load disturbance and to compare the default PSS control design with the two redesigned controllers presented in [2].
and sec. , resulting in parameters and sec., resulting in parameters and sec.
To compare the different control designs the following function is provided: C012_simulate_plot_compare
Executing this function results in a plot of the terminal voltage and speed similar to that in Fig. 10 of [2], with the main difference being that the random load has been removed to speed up the simulations. Note that the all three cases above are simulated, so if a change is made in one of them, it should be also applied to the others so that running the function gives a plot for useful comparisons.
| Name | Description |
|---|---|
| Simulates and plots the response of three models with different control designs. | |
| Default controller with kw=9.5 and tw=1.41. | |
| Re-designed controller 1 with k2=22.4455 and tw=0.5217. | |
| Re-designed controller 2 with kw=12.6924 and tw=0.5602. |
 Example1.Analysis.RedesignedControllerVerification.C012_simulate_plot_compare
Simulates and plots the response of three models with different control designs.
Usage
.png)
Sample Output
Executing the function will produce the following plot.
Extends from Modelica.Icons.Function (Icon for functions).
| Name | Description |
|---|---|
| modelname1 | Model name - default controller |
| modelname2 | Model name - controller re-design 1 |
| modelname3 | Model name - controller re-design 2 |
 Example1.Analysis.RedesignedControllerVerification.C0_8cycles
Default controller with kw=9.5 and tw=1.41.
Extends from Modelica.Icons.Example (Icon for runnable examples).
| Name | Description |
|---|---|
| Vt | |
| Q | |
| P | |
| w | |
| delta | |
| AVRin | |
| AVRout |
Example1.Analysis.RedesignedControllerVerification.C1_8cyclesRe-designed controller 1 with k2=22.4455 and tw=0.5217.
Extends from Modelica.Icons.Example (Icon for runnable examples).
| Name | Description |
|---|---|
| Vt | |
| Q | |
| P | |
| w | |
| delta | |
| AVRin | |
| AVRout |
Example1.Analysis.RedesignedControllerVerification.C2_8cyclesRe-designed controller 2 with kw=12.6924 and tw=0.5602.
Extends from Modelica.Icons.Example (Icon for runnable examples).
| Name | Description |
|---|---|
| Vt | |
| Q | |
| P | |
| w | |
| delta | |
| AVRin | |
| AVRout |